BioNMR
NMR aggregator & online community since 2003
BioNMR    
Learn or help to learn NMR - get free NMR books!
 

Go Back   BioNMR > NMR community > News from other NMR forums
Advanced Search
Home Forums Wiki NMR feeds Downloads Register Today's Posts


Jobs Groups Conferences Literature Pulse sequences Software forums Programs Sample preps Web resources BioNMR issues


Webservers
NMR processing:
MDD
NMR assignment:
Backbone:
Autoassign
MARS
UNIO Match
PINE
Side-chains:
UNIO ATNOS-Ascan
NOEs:
UNIO ATNOS-Candid
UNIO Candid
ASDP
Structure from NMR restraints:
Ab initio:
GeNMR
Cyana
XPLOR-NIH
ASDP
UNIO ATNOS-Candid
UNIO Candid
Fragment-based:
BMRB CS-Rosetta
Rosetta-NMR (Robetta)
Template-based:
GeNMR
I-TASSER
Refinement:
Amber
Structure from chemical shifts:
Fragment-based:
WeNMR CS-Rosetta
BMRB CS-Rosetta
Homology-based:
CS23D
Simshift
Torsion angles from chemical shifts:
Preditor
TALOS
Promega- Proline
Secondary structure from chemical shifts:
CSI (via RCI server)
TALOS
MICS caps, β-turns
d2D
PECAN
Flexibility from chemical shifts:
RCI
Interactions from chemical shifts:
HADDOCK
Chemical shifts re-referencing:
Shiftcor
UNIO Shiftinspector
LACS
CheckShift
RefDB
NMR model quality:
NOEs, other restraints:
PROSESS
PSVS
RPF scores
iCing
Chemical shifts:
PROSESS
CheShift2
Vasco
iCing
RDCs:
DC
Anisofit
Pseudocontact shifts:
Anisofit
Protein geomtery:
Resolution-by-Proxy
PROSESS
What-If
iCing
PSVS
MolProbity
SAVES2 or SAVES4
Vadar
Prosa
ProQ
MetaMQAPII
PSQS
Eval123D
STAN
Ramachandran Plot
Rampage
ERRAT
Verify_3D
Harmony
Quality Control Check
NMR spectrum prediction:
FANDAS
MestReS
V-NMR
Flexibility from structure:
Backbone S2
Methyl S2
B-factor
Molecular dynamics:
Gromacs
Amber
Antechamber
Chemical shifts prediction:
From structure:
Shiftx2
Sparta+
Camshift
CH3shift- Methyl
ArShift- Aromatic
ShiftS
Proshift
PPM
CheShift-2- Cα
From sequence:
Shifty
Camcoil
Poulsen_rc_CS
Disordered proteins:
MAXOCC
Format conversion & validation:
CCPN
From NMR-STAR 3.1
Validate NMR-STAR 3.1
NMR sample preparation:
Protein disorder:
DisMeta
Protein solubility:
camLILA
ccSOL
Camfold
camGroEL
Zyggregator
Isotope labeling:
UPLABEL
Solid-state NMR:
sedNMR


Reply
 
Thread Tools Search this Thread Rate Thread Display Modes
  #1  
Old 11-05-2010, 12:20 PM
nmrlearner's Avatar
Senior Member
 
Join Date: Jan 2005
Posts: 23,697
Points: 193,617, Level: 100
Points: 193,617, Level: 100 Points: 193,617, Level: 100 Points: 193,617, Level: 100
Level up: 0%, 0 Points needed
Level up: 0% Level up: 0% Level up: 0%
Activity: 50.7%
Activity: 50.7% Activity: 50.7% Activity: 50.7%
Last Achievements
Award-Showcase
NMR Credits: 0
NMR Points: 193,617
Downloads: 0
Uploads: 0
Default What's wrong with this spectrum? Bruker TPPI 2D TOCSY

What's wrong with this spectrum? Bruker TPPI 2D TOCSY

Hi,

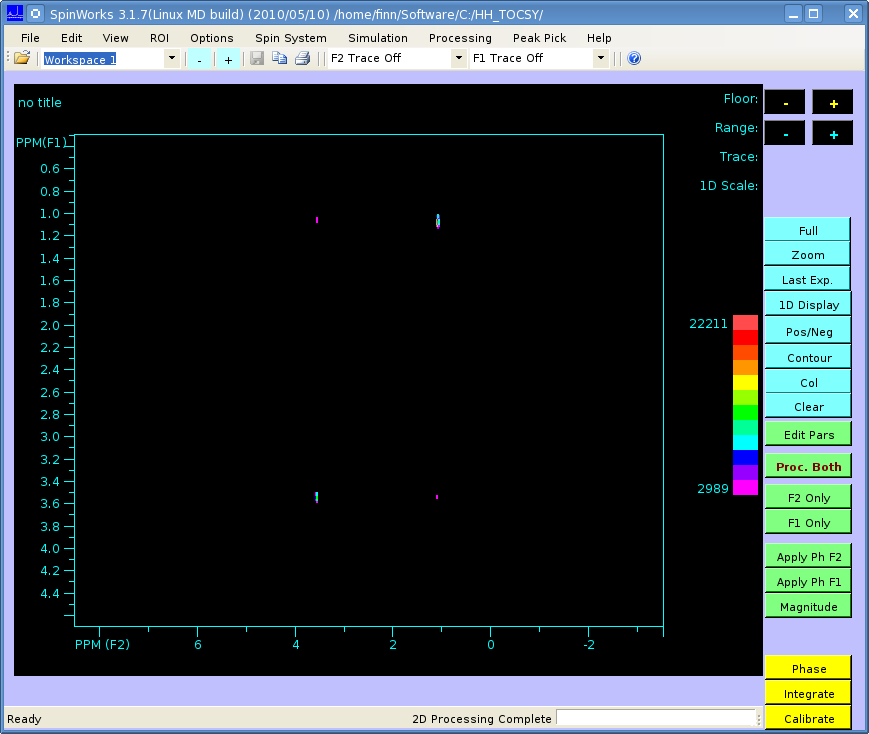
I think this is probably a basic problem but I'm a bit inexperienced with NMR. I'm just trying to process an ethanol TOCSY spectrum from the biomolecular magnetic resonance data bank, but strange peaks are appearing at the very edge of the data.

The spectrum should look like this (processed in SpinWorks):


But when I perform a 2-dimensional Fourier transform using matNMR, or the fft Matlab functions I get the following:
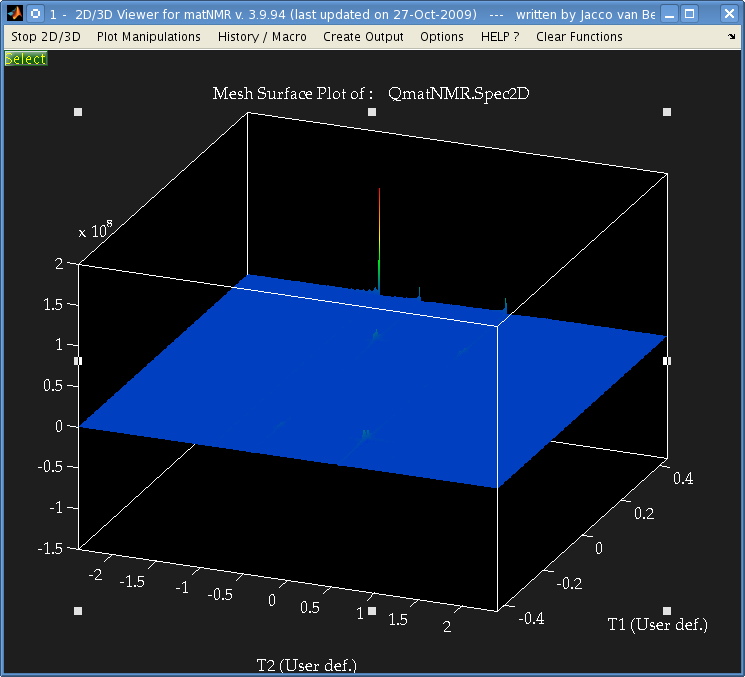


It's not easily visible but there are 4 small peaks in the body of the spectrum as well as the 3 large ones at the very edge.

The data is from a Bruker spectrometer recorded using TPPI. There were zeros at the start of the FID so I used the "remove Bruker digital filter" option before processing. I performed a Fourier Transform in the T2 direction, and then T1 direction and that is the result. I don't understand why there are peaks at the very far edge of the data, and performing an fftshift results in 3 peaks at zero frequency.

Is this a result of a problem with the phase, or possibly because of solvent peaks? I used the automatic phase adjustment but the peaks at the edge were still there.

Is there some mistake I'm making that causes those peaks to appear at the edge? I processed data from another brand of spectrometer which had used STATES and the spectrum was as expected without anything at the edges.

Also, when I process other Bruker TPPI spectra from the same data bank for adanine TOCSY and HSQC, and methanol I have the same problem.

Any ideas/sugestions would be much appreciated,Thanks


Check if somebody has answered this question on NMRWiki QA forum
Reply With Quote


Did you find this post helpful? Yes | No

Reply
Similar Threads
Thread Thread Starter Forum Replies Last Post
[Question from NMRWiki Q&A forum] what went wrong?
what went wrong? a query again? I recorded an DQF on deuterated solid sample. The basic pulse programme taken from bruker, optimised the pulse and kept the proper short delay between the last two 90 pulses? phase cycling is same as mentioned in bruker? I got empty spectrum with very poor diagonal and no cross peaks? what could possibly go wrong ? does these delays depend on higher magnetic field strengths? or pulse imperfections cause collapsed spectrum or empty spectrum? the spectra i recorded on 700 MHz with 14 KHz MAS.
nmrlearner News from other NMR forums 0 11-18-2011 06:51 PM
[Question from NMRWiki Q&A forum] Calibrate HCCH-TOCSY spectrum with reference to HBHACONH
Calibrate HCCH-TOCSY spectrum with reference to HBHACONH I am facing problems in calibration of my HCCH-TOCSY spectrum in reference to HBHACONH and HCCCONH spectrum. Can somebody tell me how to solve this issue? Can I autoassign my HCCH-TOCSY spectrum using HBHACONH spectrum Check if somebody has answered this question on NMRWiki QA forum

nmrlearner News from other NMR forums 0 10-02-2011 08:25 AM
[Question from NMRWiki Q&A forum] incorrect processing of 2D HSQC in NMRPipe - what is wrong?
incorrect processing of 2D HSQC in NMRPipe - what is wrong? i'm trying to process an HSQC by using standard scripts of NMRpipe, and get this: <img src="http://qa.nmrwiki.org/upfiles/13022976745696182.png" width="50%" /img> what is wrong in my processing? at the spectrometer the spectrum looked nice, so it's a matter of processing... conversion:
nmrlearner News from other NMR forums 0 04-09-2011 12:17 AM
[NMR paper] Spin-state-selective TPPI: a new method for suppression of heteronuclear coupling con
Spin-state-selective TPPI: a new method for suppression of heteronuclear coupling constants in multidimensional NMR experiments. Related Articles Spin-state-selective TPPI: a new method for suppression of heteronuclear coupling constants in multidimensional NMR experiments. J Magn Reson. 1999 Aug;139(2):443-6 Authors: Schulte-Herbrüggen T, Briand J, Meissner A, Sřrensen OW A novel multidimensional NMR pulse sequence tool, spin-state-selective time-proportional phase incrementation (S(3) TPPI), is introduced. It amounts to application of...
nmrlearner Journal club 0 11-18-2010 08:31 PM
[Stan NMR blog] Are Bruker and Jeol NMR data wrong?
Are Bruker and Jeol NMR data wrong? Recent FID's acquired with Bruker and Jeol spectrometers exhibit an anomalous group delay artifact ... More...
nmrlearner News from NMR blogs 0 08-21-2010 05:42 PM


Posting Rules
You may not post new threads
You may not post replies
You may not post attachments
You may not edit your posts

BB code is On
Smilies are On
[IMG] code is On
HTML code is On
Trackbacks are Off
Pingbacks are Off
Refbacks are Off


BioNMR advertisements to pay for website hosting and domain registration. Nobody does it for us.


Powered by vBulletin® Version 3.7.3
Copyright ©2000 - 2024, Jelsoft Enterprises Ltd.
Copyright, BioNMR.com, 2003-2013
Search Engine Friendly URLs by vBSEO 3.6.0

All times are GMT. The time now is 04:19 PM.


Map