Solid State NMR of Half Integer Quadrupolar Nuclei
Many students who do liquid state NMR or solid state NMR of spin
I=1/2 nuclei have very little appreciation for the information content and complexity of the solid state NMR spectra of spin
I = n/2 quadrupolar nuclei (n= 3, 5, 7....). In part, I think this may be due to the mathematics involved with explaining the important effects. With this post, I attempt to describe the NMR spectrum of an
I = 5/2 nucleus in the soild state without resorting to mathematics. I hope that this post helps to boost the understanding and appreciation for the NMR spectra of these important nuclei.
When one collects the NMR spectrum a spin
I = n/2 nucleus in solution, one normally observes
a single NMR resonance line for each species as the (n+1) Zeeman energy levels are equally spaced and the nucleus is undergoing fast isotropic motion. The width of the resonance depends upon the efficiency of the relaxation (usually dominated by the quadrupolar interaction). The more efficient the relaxation, the broader the resonance. In many cases, the width of the resonance may be comparable to the complete chemical shift range for the nucleus and in some cases it may be so broad as to make its observation impractical or impossible. For these reasons
I = n/2 quadrupolar nuclei generate less than their share of interest in liquid state NMR compared to spin
I = 1/2 nuclei like 1H, 13C, 31P ..... etc.
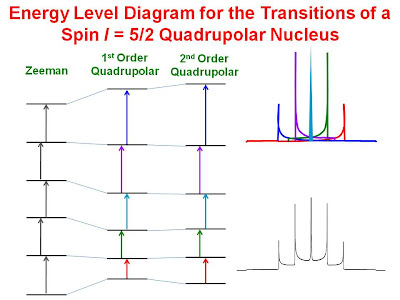
In the solid state, the situation is much different as there is rarely fast isotropic motion. When the quadrupolar interaction is much less than the Zeeman interaction, the Zeeman energy level diagram is affected by both a first order and a second order quadrupolar perturbation as shown in the figure below for an
I = 5/2 nucleus. The second order perturbation is much smaller than the first order.

The energy levels are no longer equally spaced. Furthermore, the position of the resonances resulting from the transitions depends on the orientation of the nucleus with respect to the magnetic field. Since all orientations are represented equally in a powder sample, each transition gives a
powder spectrum. This is illustrated on the right-hand side of the figure. Note that the
m = 1/2 and
m = -1/2 energy levels are affected equally to first order and that the central (
m = 1/2 -
m = -1/2) transition is affected only by the second order perturbation. As a result the line width of the resonance from the central transition is much narrower than the other transitions. (In the figure, the central transition is clipped significantly.). Unlike the first order interaction, the second order interaction is
field dependent. The width of the central transition depends inversely on the strength of the magnetic field.
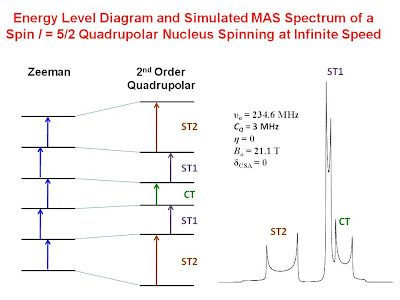
Magic angle spinning is a technique used by solid state NMR spectroscopists to obtain high resolution NMR spectra of solids. Magic angle spinning at infinite speed completely averages the first order quadrupolar interaction but only partially averages out the second order interaction. The energy level diagram for a spin
I = 5/2 nucleus spinning infinately fast at the magic angle is shown in the figure below along with a simulated spectrum.

The spectrum consists of a central transition, CT, and two satellite transitions, ST1 and ST2. Note that along with a lineshape due to the orientational dependence of the nucleus in the magnetic field, there is also an isotropic quadrupolar shift. The central and satallite transitions are not at the same frequency. This effect is completely separate from the chemical shift.
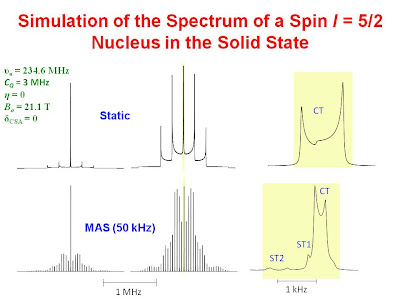
In practice, we cannot spin at infinite speed, however, we can often spin at a rate fast with respect to the width of the central transition. If the quadrupolar coupling constant is small enough, the central transition will be observed and affected only by the second order interaction. The satellite transitions, affected by both the first and second order interaction, are observed as a manifold of spinning sidebands. The intensity of the centerbands for the satellite transitions is greatly attenuated as the overall intensity is spread among all of the sidebands. Often the centerbands for the satellite transitions are so small in comparison to that of the central transition that they are not observed. This is illustrated with simulations in the lower portion of the figure below. For comparison, the upper portion shows similar simulated spectra without magic angle spinning. The spectra highlighted in yellow are expansions of the central portion of the spectrum. These simulations are also supported by
observations.


Source:
University of Ottawa NMR Facility Blog


