The Scale on an NMR Spectrum
Some people new to NMR spectroscopy have trouble with the meaning on the scales of their NMR spectra. Usually the data are plotted with a chemical shift scale (
?). This scale increases to the left and is usually reported in units of parts per million (ppm). The chemical shift of a resonance in a sample,
?sample , in ppm is defined as follows:

where
?sample is the absolute frequency of the sample resonance and
?reference is the absolute frequency of an agreed upon reference compound. For 1H, 13C and 29Si NMR, tetramethylsilane (TMS) is the agreed upon reference standard. When the scale is plotted in this manner, the peak positions are relative to that of the standard compound. This scale is particularly useful, as it independent of a
single absolute frequency and therefore does not depend on the magnetic field strength, which varies from laboratory to laboratory. Spectra recorded using magnets of unequal field strength can be compared more easily.
Scales are also plotted in frequency units (Hz), usually with the reference compound assigned a value of 0 Hz. This scale also increases to the left and is usually of use when coupling constants (which are independent of field) are being measured.
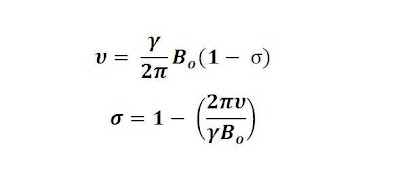
Although absolute electronic shielding values are inconvenient to measure, one may hear people refer to one resonance being "more shielded" or "less shielded" than another, The shielding constant, ?, for a particular nucleus in a particular environment can be expressed by rearranging the Larmor equation.

The shielding scale increases to the right.
In the age of continuous wave NMR spectrometers, NMR spectra were measured by irradiating the sample with continuous wave radiation and sweeping the magnetic field from a low value (on the left) to a high value (on the right). The scales were sometimes plotted in magnetic field units and one still hears about one peak being described as "upfield" or "downfield" from another. These terms have little relevance in FT NMR and should be avoided.
Some of the older literature reported 1H NMR peak positions on a
? scale. Here,
? was equal to (10 ppm -
? ) and the scale increased to the right. This is no longer in use and has caused considerable confusion. It should be avoided.


Source:
University of Ottawa NMR Facility Blog


