Intelligent Peak Picking of 1D NMR Spectra
In case you hadn´t noticed,
version 7 of Mnova was released just a few days ago.
Whilst this new version presents a number of significant improvements in the software, in this post I would like to focus on a new peak picking concept which, to the best of my knowledge, is novel and in some way, revolutionary. I will try to keep this as short and clear as possible, just to illustrate the very basic ideas that motivated this new approach to peak picking. In the next posts I will elaborate further on some of the new points introduced here.
Traditional Peak Picking
First up, to lay the groundwork for this article, lets revisit the way in which peak picking algorithms usually work in all NMR software packages, including the former versions of Mnova: Essentially, in this procedure, all peaks maxima (and/or minima) in a spectrum are determined and their values are either stored in a tabular form (i.e. in a peak table) or displayed graphically over the spectrum (Figure 1).
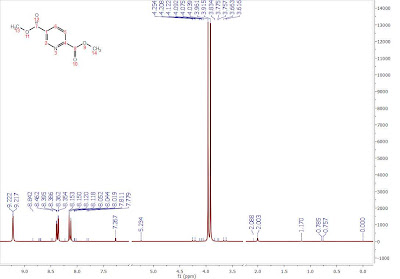
Figure 1: Illustration of traditional peak picking
Each NMR application might offer different levels of sophistication in the peak picking algorithms. For example, some can resolve overlapped peaks better than others (
http://nmr-analysis.blogspot.com/200...k-overlap.html ), others operate more efficiently with spectra with low SNR, etc.), but the important element I would like to highlight here is the fact that the output of any peak picking algorithm is just a plain list of significant points in a spectrum.
So far, so good. The question is: What is the purpose of applying peak picking? Well, there is no definitive answer and it depends upon the particular application. Nonetheless, if we restrict the context to that of the simple analysis of small molecules for their characterization, peak picking is usually applied to the calculation of coupling constants and chemical shifts, (in other words determination of the spin system(s) in the spectrum). Whenever practicable, this should be done as automatically as possible by the NMR Software.
Historically, this automatic analysis was based on Quantum Mechanical (QM) methods [1]. They are certainly the most rigorous yet complex methods, although interestingly, the most popular approaches even more than 40 years ago [2-4] when computer power was much more limited than today.
Another approach, which incidentally has attracted significant interest in recent years, despite being computationally much less demanding, is based on the same technique typically used by organic chemists, i.e. the use of the popular first-order analysis rules [5-7]. Of course, this approach is only valid in weakly coupled systems and, thus, has a more limited scope when compared to QM methods, but is useful for a rapid spectrum analysis.
In any event, regardless of the method employed, the main obstacle to achieving a successful automatic analysis of 1H NMR spectra with minimal user intervention lies in the fact that NMR spectra do not consist only of peaks arising from the transitions of the studied spin system, but also many others, such as, solvent and impurity peaks, spinning sidebands, reference peaks (e.g. TMS), satellite peaks, etc. Continuing the previous example, if the vertical intensities are expanded a little bit more, we can appreciate (see Figure 2) that peak picking finds not only the main transitions, but also many other peaks like small impurities, 13C satellites, etc.
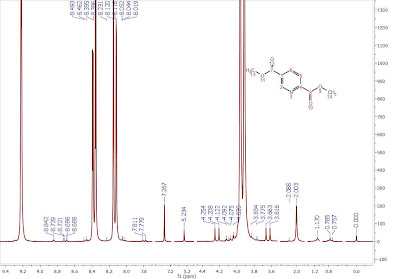
Figure 2: Expanded view of Figure 1. It can be seen that small peaks, including 13C satellites and impurities are detected, but they lack any kind of classification.
This is certainly good as those peaks are real and it is important to detect them. However, the problem is that, in general, those peaks are not labeled or marked according to their type (compound, solvent, 13C satellite, impurity, etc): They are just peaks, they do not have a semantic context and do not present any further characterization. This has some important consequences when automatic analysis is required. For example, solvent peaks should be marked appropriately so that they are not used during the actual analysis. Same applies to impurities, 13C peaks, etc.
Intelligent Peak Picking
By Intelligent I mean a Peak Picking algorithm equipped with the ability to classify and mark a peak according to their type. Of course, the identification of any obvious impurity or solvents is a task an experienced chemist is very familiar with and can do very efficiently, and for this reason, it is very important that any software provides the user the ability to manually classify a peak. Of course, automation is very important, but this kind of analysis is extremely difficult for a computer program. Impurity or solvent peaks can overlap with compound resonances, making some simple strategies based on the definition of solvent regions ineffective.
Just to give you a first impression on how an Intelligent Peak Picking looks like in Mnova, take a look at Figure 3:
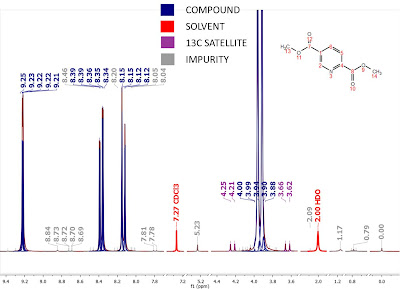
Figure 3
This is the result of a fully automatic Peak Picking. Some points are worth noting:
- As you can see, now the peak labels have different colors. They are color coded according to their classification (i.e. compound peak, impurity, solvent, etc) as per the legend shown in the figure. Once again, this classification has been done fully automatically by Mnova, but manual intervention is always possible.
- Typically, peak picking algorithms use to include the so-called threshold parameter used to filter out small peaks in a spectrum. This is not very convenient, for many reasons, including:
- a. It is very difficult to find a threshold parameter that works well under all spectral conditions. Even though this parameter can be used relatively to the noise level in a spectrum, very often it has to be tuned manually in order to get good results.
- b. As this threshold parameter usually works globally across the spectrum, if it is set too high to filter small noisy or impurity peaks, we run into the risk of losing small compound peaks, for example, the small peaks in both sides of a heptaplet.
- c. It is also very sensitive to baseline imperfections.
- All the drawbacks outlined above are strongly alleviated (if not fully resolved) by the intelligent peak picking included in Mnova 7.0. Why and how will be the subject of my future posts.
Conclusions
Unlike traditional peak picking algorithms, the intelligent version presented for the first time in Mnova 7.0 adds an extra dimension: every peak is automatically classified according to different descriptors, ranging from peak compound, impurities, 13C satellites, solvent, etc. The automation of this classification is possible thanks to a fuzzy logic expert system developed in Mnova and which I will describe shortly in future posts.
In my opinion, this peaks classification opens new avenues in the automatic analysis of 1H NMR spectra of small molecules. For example, multiplet analysis using first order rules is much more efficient, especially in cases of sever signal overlap or multiplets contaminated with solvent peaks. For example, Figure 4 shows the result of analyzing the spectrum of Santonin fully automatically (i.e. with one button click).

Figure 4
In my upcoming posts I will describe in more detail this new approach to NMR peak picking and 1H NMR analysis, including automatic solvent detection, multiplet analysis and automatic determination of the number of protons in a spectrum. Stay tuned!
References:- P. Diehl, S. Sykora and J. Vogt, J. Magn. Reson. 19, 67 (1975).
- J.D. Swalen and C.A. Reilly, J. Chem. Phys. 37, 21 (1962).
- S. Castellano and A.A. Bothner-By, J. Chem. Phys. 41, 3863 (1964).
- D.S. Stephenson and G. Binsch, J. Magn. Reson. 37, 395 (1980).
- T.R. Hoye and H. Zhao, J. Org. Chem. 67, 40144016 (2002).
- C. Cobas, V. Constantino-Castillo, M. Martín-Pastor and F. del Río-Portilla, Magn. Reson. Chem. 43, 843848 (2005).
- S. Bourg, J.-M. Nuzillard, J. Chim. Phys. 95, 18 (1998).
 More...
Source:
NMR-analysis blog


 Linear Mode

