BioNMR
NMR aggregator & online community since 2003
BioNMR    
Learn or help to learn NMR - get free NMR books!
 

Go Back   BioNMR > NMR community > News from NMR blogs
Advanced Search
Home Forums Wiki NMR feeds Downloads Register Today's Posts


Jobs Groups Conferences Literature Pulse sequences Software forums Programs Sample preps Web resources BioNMR issues


Webservers
NMR processing:
MDD
NMR assignment:
Backbone:
Autoassign
MARS
UNIO Match
PINE
Side-chains:
UNIO ATNOS-Ascan
NOEs:
UNIO ATNOS-Candid
UNIO Candid
ASDP
Structure from NMR restraints:
Ab initio:
GeNMR
Cyana
XPLOR-NIH
ASDP
UNIO ATNOS-Candid
UNIO Candid
Fragment-based:
BMRB CS-Rosetta
Rosetta-NMR (Robetta)
Template-based:
GeNMR
I-TASSER
Refinement:
Amber
Structure from chemical shifts:
Fragment-based:
WeNMR CS-Rosetta
BMRB CS-Rosetta
Homology-based:
CS23D
Simshift
Torsion angles from chemical shifts:
Preditor
TALOS
Promega- Proline
Secondary structure from chemical shifts:
CSI (via RCI server)
TALOS
MICS caps, β-turns
d2D
PECAN
Flexibility from chemical shifts:
RCI
Interactions from chemical shifts:
HADDOCK
Chemical shifts re-referencing:
Shiftcor
UNIO Shiftinspector
LACS
CheckShift
RefDB
NMR model quality:
NOEs, other restraints:
PROSESS
PSVS
RPF scores
iCing
Chemical shifts:
PROSESS
CheShift2
Vasco
iCing
RDCs:
DC
Anisofit
Pseudocontact shifts:
Anisofit
Protein geomtery:
Resolution-by-Proxy
PROSESS
What-If
iCing
PSVS
MolProbity
SAVES2 or SAVES4
Vadar
Prosa
ProQ
MetaMQAPII
PSQS
Eval123D
STAN
Ramachandran Plot
Rampage
ERRAT
Verify_3D
Harmony
Quality Control Check
NMR spectrum prediction:
FANDAS
MestReS
V-NMR
Flexibility from structure:
Backbone S2
Methyl S2
B-factor
Molecular dynamics:
Gromacs
Amber
Antechamber
Chemical shifts prediction:
From structure:
Shiftx2
Sparta+
Camshift
CH3shift- Methyl
ArShift- Aromatic
ShiftS
Proshift
PPM
CheShift-2- Cα
From sequence:
Shifty
Camcoil
Poulsen_rc_CS
Disordered proteins:
MAXOCC
Format conversion & validation:
CCPN
From NMR-STAR 3.1
Validate NMR-STAR 3.1
NMR sample preparation:
Protein disorder:
DisMeta
Protein solubility:
camLILA
ccSOL
Camfold
camGroEL
Zyggregator
Isotope labeling:
UPLABEL
Solid-state NMR:
sedNMR


Reply
 
Thread Tools Search this Thread Rate Thread Display Modes
  #1  
Old 04-17-2015, 08:49 PM
nmrlearner's Avatar
Senior Member
 
Join Date: Jan 2005
Posts: 23,777
Points: 193,617, Level: 100
Points: 193,617, Level: 100 Points: 193,617, Level: 100 Points: 193,617, Level: 100
Level up: 0%, 0 Points needed
Level up: 0% Level up: 0% Level up: 0%
Activity: 50.7%
Activity: 50.7% Activity: 50.7% Activity: 50.7%
Last Achievements
Award-Showcase
NMR Credits: 0
NMR Points: 193,617
Downloads: 0
Uploads: 0
Default The Information Content of an FID

The Information Content of an FID

The free induction decay (FID) is a function representing the decay of transverse magnetization as a function of time after the application of a pulse (or pulse sequence). The NMR spectrum is obtained by Fourier transforming the FID. All of the information in the NMR spectrum (line width, intensity, phase, line shape ....) is contained in the FID. Knowledge of what part of the FID represents a particular property of an NMR spectrum allows a user to process the raw time domain data in a way that maximizes the quality and information content of the processed frequency domain spectrum. The figure below shows the real component of the complex FID for a sample in which there is a single resonance. The FID is labelled in terms of its information content.
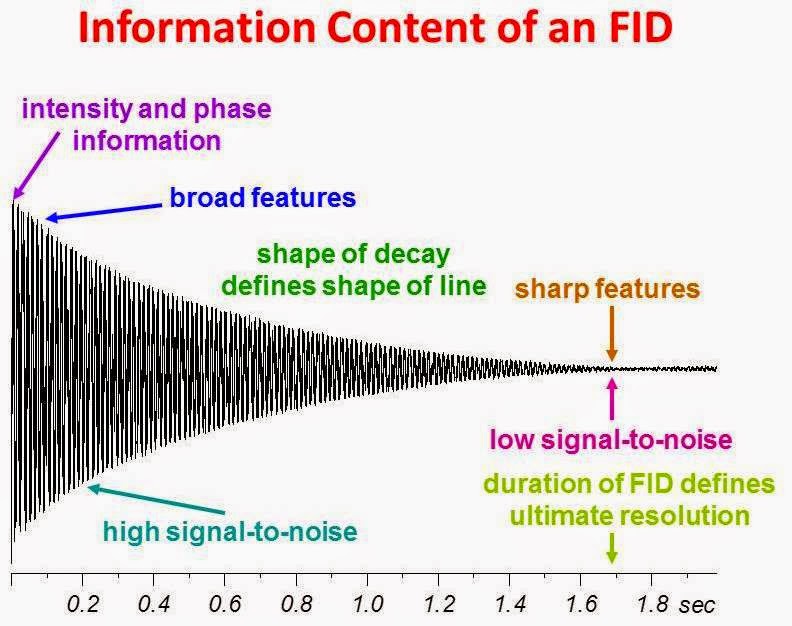
The shape of the envelope of the overall decay defines the line shape of the NMR resonance. Exponential decays yield Lorentzian line shapes. The frequency in the FID represents the offset of the resonance from the carrier frequency or in other words, how far the resonance is from the center of the spectrum. The higher the frequency, the further off-resonance the peak. The FID for an on-resonance peak is a simple decaying exponential with no oscillation frequency present. The first point of the FID contains the integrated intensity and phase information. Since time and frequency are reciprocals of one another, the duration of the decay before it disappears into the noise determines the sharpness of the NMR resonances and ultimately the resolution in cases where there is more than one resonance in the spectrum. The longer the decay - the narrower the lines. The early portion of the FID (short time) defines the broad features (wide frequency distributions) whereas the the latter portion of the FID (long time) defines the sharp features (narrow frequency distributions). Also, since the FID is a decaying function, the early portion has a higher signal-to-noise ratio than the latter portion. With this knowledge its is very easy to understand how best to apply apodization functions to the raw data for the purpose line broadening and resolution enhancement. Processing techniques such as zero filling, forward linear prediction, backward linear prediction and signal-to-noise optimization as well as spectral artifacts such as truncation errors, baseline roll and receiver saturation errors are easily understood with knowledge of the information content in the FID.


Source: University of Ottawa NMR Facility Blog
Reply With Quote


Did you find this post helpful? Yes | No

Reply
Similar Threads
Thread Thread Starter Forum Replies Last Post
[NMR images] NMR(nuclear magnetic resonance) Oil Content Analyzer
http://i00.i.aliimg.com/photo/v0/517608066/NMR_nuclear_magnetic_resonance_Oil_Content_Analyzer.jpg 3/05/2014 7:50:47 AM GMT NMR(nuclear magnetic resonance) Oil Content Analyzer More...
nmrlearner NMR pictures 0 05-03-2014 07:50 AM
[NMR images] NMR (Nuclear Magnetic Resonance) Oil Content Analyzer
http://image.made-in-china.com/2f0j00pKsQofVaIEcr/NMR-Nuclear-Magnetic-Resonance-Oil-Content-Analyzer.jpg 3/05/2014 7:50:47 AM GMT NMR (Nuclear Magnetic Resonance) Oil Content Analyzer More...
nmrlearner NMR pictures 0 05-03-2014 07:50 AM
[NMR images] NMR(nuclear magnetic resonance) Oil Content Analyzer
http://i01.i.aliimg.com/photo/v5/311696785/NMR_nuclear_magnetic_resonance_Oil_Content_Analyzer.jpg 17/03/2014 6:52:30 AM GMT NMR(nuclear magnetic resonance) Oil Content Analyzer More...
nmrlearner NMR pictures 0 03-17-2014 06:52 AM
[NMR paper] Determination of the casein content in bovine milk by 31P-NMR.
Determination of the casein content in bovine milk by 31P-NMR. Related Articles Determination of the casein content in bovine milk by 31P-NMR. J Dairy Res. 2002 Aug;69(3):411-8 Authors: Belloque J, Ramos M The relative proportion of caseins to total protein is a parameter that can be used to control the protein quality in standardised milk, an increasing tendency in dairy industries. 31P-NMR was used to analyse the casein content of milk, by the quantitation of the area under the resonances belonging to SerP, and using methylenediphosphonic...
nmrlearner Journal club 0 11-24-2010 08:58 PM
[NMR tweet] www.sciencia.org Determination of Dry Matter Content in Potato Tubers by Low-Field Nu
www.sciencia.org Determination of Dry Matter Content in Potato Tubers by Low-Field Nuclear Magnetic Resonance (LF-NMR) http://dlvr.it/5hnTV Published by AgricultureSci (Sciencia Agriculture) on 2010-09-22T05:12:03Z Source: Twitter
nmrlearner Twitter NMR 0 09-22-2010 05:42 AM
[NMR tweet] www.bio-network.org Determination of Dry Matter Content in Potato Tubers by Low-Field
www.bio-network.org Determination of Dry Matter Content in Potato Tubers by Low-Field Nuclear Magnetic Resonance... http://dlvr.it/5hRw3 Published by AgricultureMag (Eureka Agriculture) on 2010-09-22T02:49:15Z Source: Twitter
nmrlearner Twitter NMR 0 09-22-2010 02:52 AM
[NMR paper] Quantitative evaluation of water content in a solid protein by deuterium NMR.
Quantitative evaluation of water content in a solid protein by deuterium NMR. Related Articles Quantitative evaluation of water content in a solid protein by deuterium NMR. Biochim Biophys Acta. 1992 Feb 26;1119(2):178-84 Authors: Tamura A, Akasaka K A method for evaluating absolute water content in a solid protein based on deuterium NMR measurements in solution is described. By dissolving the hydrated solid protein, which has been specifically deuterium-labeled, into deuterium-depleted water and by comparing the deuterium NMR signal intensity...
nmrlearner Journal club 0 08-21-2010 11:41 PM
[NMR paper] Exploring the dynamic information content of a protein NMR structure: comparison of a
Exploring the dynamic information content of a protein NMR structure: comparison of a molecular dynamics simulation with the NMR and X-ray structures of Escherichia coli ribonuclease HI. http://www.ncbi.nlm.nih.gov/corehtml/query/egifs/http:--www3.interscience.wiley.com-aboutus-images-wiley_interscience_pubmed_logo_120x27.gif Related Articles Exploring the dynamic information content of a protein NMR structure: comparison of a molecular dynamics simulation with the NMR and X-ray structures of Escherichia coli ribonuclease HI. Proteins. 1999 Jul 1;36(1):87-110 ...
nmrlearner Journal club 0 08-21-2010 04:03 PM


Posting Rules
You may not post new threads
You may not post replies
You may not post attachments
You may not edit your posts

BB code is On
Smilies are On
[IMG] code is On
HTML code is Off
Trackbacks are Off
Pingbacks are Off
Refbacks are Off


BioNMR advertisements to pay for website hosting and domain registration. Nobody does it for us.


Powered by vBulletin® Version 3.7.3
Copyright ©2000 - 2024, Jelsoft Enterprises Ltd.
Copyright, BioNMR.com, 2003-2013
Search Engine Friendly URLs by vBSEO 3.6.0

All times are GMT. The time now is 02:42 PM.


Map