Faster Relaxation Time Measurements in Solids
T1 relaxation times are typically measured with
the inversion recovery technique. In this method the magnetization is inverted and its recovery is monitored as a function of time. For nuclei with long T1's, the measurements are very time consuming as a recycle delay of at least five times T1 must be used between scans. Typical T1's for 13C in the solid state range from several seconds to tens of minutes, so their direct measurement via the
inversion recovery method could be prohibitively long.
High resolution 13C solid state NMR spectra of solids are routinely measured with
cross polarization and
magic angle spinning (CPMAS) in order to take advantage of the signal enhancement due to magnetization transfer between the abundant protons and isotopically dilute 13C nuclei. Additionally, the recycle delay needed for this measurement depends on the
T1? of the protons rather than the T1 of the 13C. Proton
T1?'s are typically shorter than 13C T1's by at least an order of magnitude, so many more scans can be collected per unit data collection time compared to a direct one-pulse measurement.
One might think that 13C T1's can simply be measured with cross polarization using a simple inversion recovery scheme by applying a 90° pulse to the 13C spins immediately following the
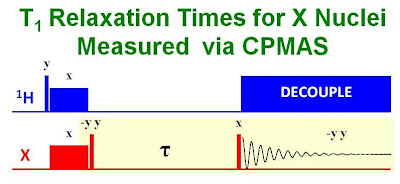
contact pulse and then following their recovery over time. This method would have both the advantages of signal enhancement due to CP and more scans per unit time. The problem however, is that the enhanced magnetization of the inverted spins relaxes back to its unenhanced Boltzmann value and not its enhanced value. So, in order to measure the T1, the direct 13C magnetization would have to be measured first (without CP) which would be very time consuming. This difficulty can be eliminated with the pulse sequence introduced by Torchia in 1978* shown in the figure below.


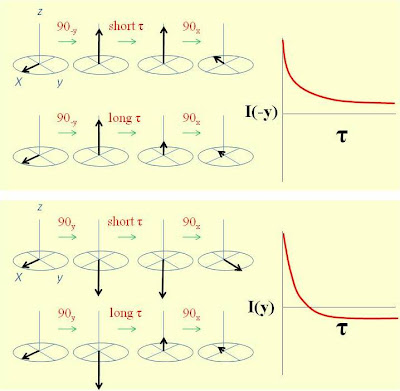
This sequence uses a simple two step phase cycle to subtract out the effect of the direct 13C Boltzmann magnetization. The first part of the sequence uses a (90°-y) pulse to return the CP enhanced magnetization to the z axis. The decay of the enhanced magnetization down to its Boltzmann value is followed using a (90°x) pulse with detection of signals on the -y axis. The second part of the sequence uses a (90°y) pulse to put the CP enhanced magnetization on the -z axis. The recovery of the enhanced inverted magnetization back to its equilibrium Boltzmann value is followed using a (90°x) pulse with detection of signals on the y axis. The addition of the first and second parts of the experiment by way of the phase cycle allows for a simple calculation of the 13C T1 with both the advantages of CP enhancement and the ability to collect more scans per unit time. An illustration of this method is shown in the figure below where the 13C T1's of glycine were measured. (The small peak in the spectrum is a spinning sideband of the carbonyl carbon)

* D.A. Torchia, J. Mag. Res.
30, 613, (1978).


Source:
University of Ottawa NMR Facility Blog


